
Monitoring the process of alcohol fermentation
THE PRINCIPLE
Alcohol fermentation is a type of anaerobic respiration. Fermentation can be defined as a process that releases energy from sugars or other organic molecules. It does not require oxygen (but sometimes can occur in its presence). It does not require the use of the Krebs cycle or an electron transport chain. It uses an organic molecule as the final electron acceptor. Alcohol fermentation begins with the glycolysis of a molecule of glucose to yield two molecules of pyruvic acid. The two molecules of pyruvic acid are then reduced to two molecules of ethanol. The ethanol and CO2 are the final products of alcohol fermentation.
Alcohol fermentation is carried out by a number of bacteria and yeasts.
Alcohol fermentation is also a biotechnological process. In this process we use yeasts Saccharomyces as bioculture and water solution of monosaccharides as the culture media.
The quantity and the sort of monosaccharides influence the efficiency of alcohol fermentation.
Yeasts involved in the production of alcoholic beverages are capable of facultative anaerobic growth. If given access to oxygen, yeasts perform aerobic respiration to metabolize carbohydrates to CO2 and water. Denied oxygen they ferment carbohydrates and produce ethanol and CO2.
Monitoring the bioprocess
A sample is taken out of the bioreactor and filtered in order to remove yeast cells. 3,5-dinitrosalicylic acid is added in order to dye the sample yellow. When heated in the presence of glucose, 3,5-dinitrosalicylic acid transforms into 3-amino,5-nitrosalicylic acid, which dyes the sample red-brown. The quantity of glucose determines the colour of the sample. The more glucose, the darker the sample.
The intensity of the sample's colour is measured by a SpektraTM spectrometer using the blue LED light.
REAGENTS
- solution of 3,5-dinitrosalicylic acid (DNS reagent)
Prepare 10 g DNS and dissolve it in 200 mL of NaOH solution (c= 2 mol/L). Heat and stir intensively during the disolution. Add the dye stabilizer - solution of KNaC4H4O6× 4H2O. 300 g KNaC4H4O6× 4H2O dissolve in 500 mL of distilled water.
Mix up both solutions and fill to 1L with distilled water.
HAZARDS
 |
3,5 -
dinitrosalicylic acid, Xn
R: 20/21/22
S: 24/25
|
PROCEDURE
Bioreactor
Prepare the bioreactor for the anaerobic process with non - immobilized bioculture. The bioreactor must have a drain to release the carbon dioxide.
Culture media
Prepare 5 kg water solution of glucose (w = 13%)
Bioculture
Prepare the suspension of yeast cells and water (4g yeast / 5 L water). The quantity of yeast cells in suspension should be approximately 2×10⁸ /mL.
Basic standard glucose solution
Prepare water solution of glucose (γ(glu) = 15 mg/mL)
Preparation of measuring sample
Obtain 10 mL of culture broth from the bioreactor and filter it to remove yeast cells. Take 1 mL of the filtered sample and mix up with 9 mL distilled water.
Preparation of solutions for measuring the curve
Label five 100 mL flasks. Fill them as shown in the following table:
Flask label |
Basic standard glucose solution |
Distilled water |
Glucose concentration in solutions |
1 |
2 mL |
98 mL |
0.3 mg/mL |
2 |
3 mL |
97 mL |
0.45 mg/mL |
3 |
6 mL |
94 mL |
0.9 mg/mL |
4 |
8 mL |
92 mL |
1.2 mg/mL |
5 |
10 mL |
90 mL |
1.5 mg/mL |
Shake well. Mass concentrations of glucose in the prepared solutions are shown in the previous table.
MEASUREMENTS
Prepare 7 labelled tubes and fill them as shown in following table:
Tube label |
DNS |
Distilled water |
Solutions for measuring curve
(1 mL in each tube) |
Sample from bioreactor (filtered) |
0 |
1 mL |
3 mL |
|
|
1 |
1 mL |
2 mL |
1 mL 0.3 mg/mL |
|
2 |
1 mL |
2 mL |
1 mL 0.45 mg/mL |
|
3 |
1 mL |
2 mL |
1 mL 0.9 mg/mL |
|
4 |
1 mL |
2 mL |
1 mL 1.2 mg/mL |
|
5 |
1 mL |
2 mL |
1 mL 1.5 mg/mL |
|
S |
1 mL |
2 mL |
|
1 mL |
Heat the filled tubes in boiling water for 5 minutes. The reagent DNS will react with glucose and the colours of samples will change and become darker. After cooling add 6 mL of distilled water into each tube. Now each tube contains 10 mL dyed solution. Shake well. Pipette 400 µL of well mixed solution into the hollows of a blister. Fill every solution in its own hollow. The tube labelled with 0 contains blank sample.
Measure the transmitance with a SpectraTM spectrometer using the blue LED against the blank sample.
RESULTS
Table 1: Calibration curve (A = f(γglucose))
γglucose |
0 |
0.15 |
0.3 |
0.45 |
0.9 |
1.2 |
1.5 |
A |
0.52 |
0.57 |
0.63 |
0.65 |
0.72 |
0.81 |
0.89 |
Graph 1: Measuring curve- absorbance related to mass concentration
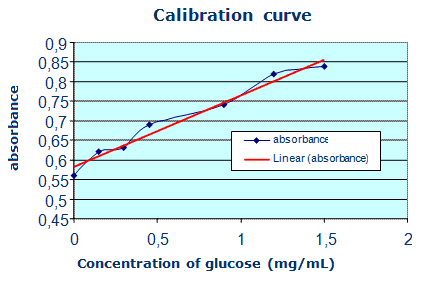
Table 2: Results of 4 weeks monitoring
Anaerobic conditions |
A |
γ (mg/mL) |
start |
0.85 |
1.3 |
1. week |
0.68 |
0.7 |
2. week |
0.65 |
0.45 |
3. week |
0.60 |
0.25 |
4. week |
0.59 |
0.25 |
g glucose/100mL sample = γ glucose in samples determined from graph 1 . 10
10 = dilution
A = absorbance (calculated from T) A = - log T
Prepared by: Alma Kapun Dolinar and Irena Štrumbelj Drusany, Boštjan Ozimek, Biotehniški izobraževalni center Ljubljana
|