|


|
sample blank |
sol.1 |
sol.2 |
sol.3 |
sol.4 |
sol.5 |
sol.6 |
sol.7 |
sample |
Conc. of Cl– (mmol/L) |
/ |
120 |
100 |
80 |
60 |
40 |
20 |
10 |
? |
Purified water |
1 |
/ |
/ |
/ |
/ |
/ |
/ |
/ |
/ |
Sol. Cl– |
/ |
1 |
1 |
1 |
1 |
1 |
1 |
1 |
1 |
Working reagent |
11 |
11 |
11 |
11 |
11 |
11 |
11 |
11 |
11 |
Values of measured dilutions absorbance are entered in the diagram and a calibration curve is drawn. The calibration curve indicates that absorbance is proportional with concentration. Then the transmittance of the sample is measured, absorbance calculated and concentration of the sample is read from calibration curve.
Measurements
|
sample blank |
sol.1 |
sol.2 |
sol.3 |
sol.4 |
sol.5 |
sol.6 |
sol.7 |
sample |
Conc. of Cl– (mmol/L) |
/ |
120 |
100 |
80 |
60 |
40 |
20 |
10 |
? |
Measured transmittance (%) |
|
|
|
|
|
|
|
|
|
Calculated absorbance |
|
|
|
|
|
|
|
|
|
RESULTS
Measurements of students:
|
sample blank |
sol.1 |
sol.2 |
sol.3 |
sol.4 |
sol.5 |
sol.6 |
sol.7 |
sample |
Conc. of Cl– (mmol/L) |
/ |
120 |
100 |
80 |
60 |
40 |
20 |
10 |
? |
Measured transmittance (%) |
100 |
65.8 |
66.8 |
72.1 |
80.5 |
89.5 |
94.4 |
96.8 |
70.6 |
Calculated absorbance |
0 |
0.18 |
0.17 |
0.14 |
0.09 |
0.05 |
0.02 |
0.01 |
0.15 |
Calibration curve : Correlation of absorbance (A) with molar concentration.
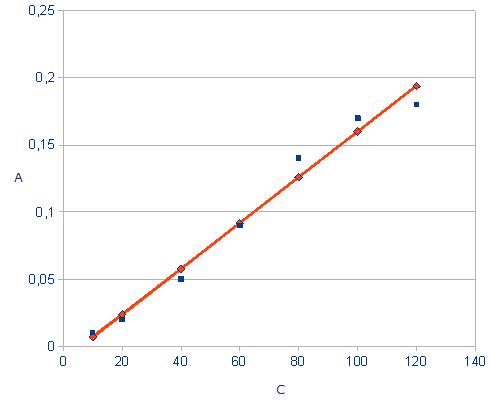
Comment: straight red line was calculated statistically with LINEST function (linear regression).
Result:
Value of concentration of the unknown serum sample read from calibration curve is 95 mmol/L. The accurate value of control serum offered by manufacturer is 98.7 mmol/L.
Prepared by: Sabina Povhe Lenart, Secondary school for pharmacy, cosmetics and health care, Ljubljana