|

DETERMINATION OF AMMONIUM IN WATER
Objective
To prepare a calibration curve in order to determine the amount of ammonium ions in a water sample.
Background
The content of ammonia and ammonium ions in water serves as an indicator of water pollution.
Ammonia is highly soluble in water, and reacts to form the ammonium ion NH4+.
The concentration of ammonia in water affects its taste and smell. Odour detection threshold for ammonium in water is approximately 1.5 mg/L, the threshold of taste perception is 35 mg/L.
Concentrations in groundwater and surface water are usually below 0.2 mg/L, under anaerobic conditions in groundwater, the concentrations can exceed 3 mg/L.
Ammonium ions in water are the result of municipal, agricultural and industrial pollution.
They can be found in drinking water after the disinfection of water with chloramine, but they can also migrate from cement pipes.
The limit for NH4+ in drinking water is 0.50 mg /L, the recommended value is 0.05 mg/L, 0.5 mg/L for water for fish and max 0.1 mg/L for the water in swimming pools.
Principle of the experiment
Reagent 1 (R1) and reagent 2 (R2) at about pH 12.6, with ammonium ions form the green-blue compound that is suitable for spectrometric determination.
The red LED at its maximum intensity is used.
Concentrations of ammonium (NH4+) in calibration solutions are between 0.125 and 1.00 mg/L.
Equipment and reagents
Reagents:
- reagent 1 (R1),
- reagent 2 (R2),
- ammonium stock solution 1.0 mg/L
Equipment:
- beaker 50 mL,
- 2 x beakers 400mL,
- 2 x volumetric flask 1L,
- 2 x volumetric flask 500mL,
- pipettes 10 mL
- SpektraTM spectrometer,
- blisters,
- plastic droppers 10 mL,
- lab scale,
- analytical balance.
Hazards
|
Ammonium chloride NH4Cl
R: 22–36
S: 22
|
|
Sodium hydrokside NaOH
R: 35
S: 1/2, 26- 36,37/39- 45
|
|
Sodium salicylate C7H5O3Na
R: 22-36
S: 24, 25
|
|
|
Sodium nitroprusside (Sodium pentacyanonitrosylferrate) Na2Fe(CN)5NO
R: 28-32-50/53
S: 7-28, 1-29-45-60-61
|
|
|
Sodium dichloroisocyaurate C3Cl2N3NaO3
R: 8-22-31-36/37-50/53
S: 8-26-41-60-61
|
|
|
|
Trisodium citrate Na3C6H5O7 |
Procedure
Preparation of stock solution:
Weigh 0.2965 g of ammonium chloride into a beaker, dissolve it and dilute with distilled water to 1.0 L in a volumetric flask. 10 mL of this solution is diluted to 1.0 L in a volumetric flask to make the ammonium ion stock solution.
Fill the plastic droppers with stock solution.
Preparation of reagent solutions:
Reagent 1:
Dissolve 75 g sodium salicylate and 75 g trisodium citrate in approximately 350 mL of distilled water. Add 0.47 g of sodium pentacyanonitrosylferrate, dissolve and dilute with distilled water to 500 mL in a volumetric flask.
Store the solution in a refrigerator. The reagent is stable for two weeks.
Fill the plastic droppers with the prepared reagent solution (R1).
Reagent 2:
Dissolve 16.0 g of sodium hydroxide in approximately 250 mL of distilled water. Cool the solution and add 1,00 g sodium dichloroisocyaurate. Dissolve the solid in the solution and dilute with distilled water to 500 mL in a volumetric flask.
Fill the plastic droppers with the prepared reagent solution (R2).
Sample preparation:
Water samples are: drinking water, surface water, ground water, water from aquariums, and water from swimming pools.
If water samples are opaque, filter them prior to analysis.
Fill the plastic droppers with water samples.
Spectrometric measurement:
- Prepare a blank sample and eight calibration solutions by measuring drops on a blister as follows in the Table 1.
Table 1:
|
Blank sample |
CS1 |
CS2 |
CS3 |
CS4 |
CS5 |
CS6 |
CS7 |
CS8 |
Sample |
Diluted H2O |
8 |
7 |
6 |
5 |
4 |
3 |
2 |
1 |
- |
- |
Stock solution
NH4+ |
- |
1 |
2 |
3 |
4 |
5 |
6 |
7 |
8 |
- |
Sample |
- |
- |
- |
- |
- |
- |
- |
- |
- |
8 |
R1 |
2 |
2 |
2 |
2 |
2 |
2 |
2 |
2 |
2 |
2 |
R2 |
2 |
2 |
2 |
2 |
2 |
2 |
2 |
2 |
2 |
2 |
T/% |
|
|
|
|
|
|
|
|
|
|
A |
|
|
|
|
|
|
|
|
|
|
g NH4+
(mg/L)
|
0 |
0.125 |
0.250 |
0.375 |
0.500 |
0.625 |
0.750 |
0.875 |
1.000 |
? |
- Transmittance of solutions can be measured after 1 hour to allow reaction to complete and the solutions become green-blue. Use red LED at its maximum intensity.
- Set the transmittance for the blank to 100.0 before taking the absorbance of any solution.
- Write the transmittances into the table.
- Calculate absorbance and write it into the table.
Prepare a calibration graph. Use the linear equation obtained for your calibration data.
Graph: calibration curve
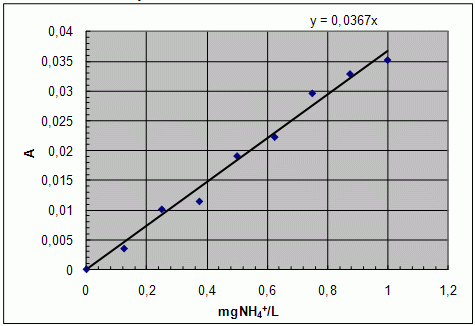
- Either read the concentration of ammonium ions in individual water samples from the graph or calculate it using linear equations of the derived line.
- Give the results for NH4+ in mg /L.
Results
|
Water sample |
A |
|
g NH4+
(mg/L)
|
|
Developed and prepared by: Romana Mele and Helena Prevc, ŠC SSKŠ Ljubljana |