|
HANDS-ON APPROACH TO LAMBERT – BEER’S LAWObjectiveThe objective of this activity is to introduce the Lambert – Beer’s Law through the hands-on approach.
|
||||||||||||||||||||||||||||||||||||||||||||||||||||||||||||||||||||||||||||||||||||||||||||||||||||||||||||||||||||||
|
F - radiation power |
Fi = ? |
| Transmittance: T = Fi / F0 |
F0 |
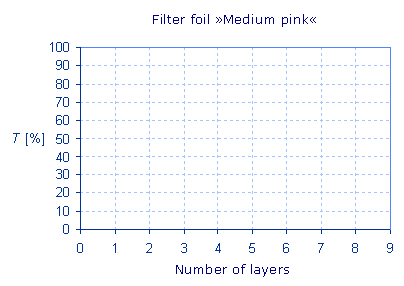
Plot the results in the graph below.

Define the relationship between the transmittance and the light path length through the absorption medium (b).
T µ
Experiment 2: The influence
of the increased concentration
of solution (c) on transmittance
The purpose of the experiment is to find the relation between the transmittance and the concentration of a solution.
Hazards
|
|
KMnO4 is harmful if swallowed, inhaled or absorbed through the skin. It is a powerful oxidant and reacts vigorously with organic substances. Use goggles and a lab coat, and avoid contact with skin. Do not dispose of the substance into the environment. Risk phrases: 22, 8, 50/53 |
|
|
|
|
|
Procedure
Prepare nine solutions of KMnO4 of different concentrations in the hollows of a blister, as shown in the table below. The transmittance is measured against deionized water, using green LED. The results must be presented in a graphic form.

|
KMnO4(S) |
-* |
1 |
2 |
3 |
4 |
5 |
6 |
7 |
8 |
9 |
| H2O (S) |
9 |
8 |
7 |
6 |
5 |
4 |
3 |
2 |
1 |
0 |
Blue boxes marked with *
denote a blank.
The concentration of the
stock solution of KMnO4
is 10 mmol/L.
Plot the results in the graph below.

Define the relationship between the transmittance and the concentration of the solution (c).
T µ
Experiment 3: Impact of different
substances/species on transmittance
The purpose of this experiment is to demonstrate how the transmittance changes if the dichromate ions in the solution are changed into the chromate ions.
| Cr2O72- + 2 OH- |
|
2 CrO42- + H2O |
| (orange) |
|
(yellow) |
Hazards
|
|
NaOH is a corrosive substance, causing burns of eyes, skin, and digestive system irritant. Avoid contact with skin and eyes. Use goggles and a lab coat for personal protection. Risk Phrase: 34 |
|
|
K2Cr2O7 is highly toxic and dangerous for the environment. Contact with skin may cause over sensitisation. The substance is toxic if ingested. For personal protection use gloves and goggles, do not dispose of the substance into the environment. Risk Phrases: 49-46-21-25-26-37/38-41-43-50/53 |
|
|
|
|
|
Procedure
Take a blister and prepare a blank and five dichromate solutions. Also prepare a blank and five solutions of chromate in different concentrations. The preparation procedure is presented in the table below. Use the stock solution of K2Cr2O7, 11 mmol/L, and deionised water, and the solution of NaOH, 2 mol/L.
|
|
Blank |
Dichromate solutions |
||||
| K2Cr2O7(S) |
- |
1 |
2 |
3 |
4 |
5 |
| NaOH (S) |
- |
- |
- |
- |
- |
- |
| H2O (S) |
9 |
8 |
7 |
6 |
5 |
4 |
|
|
Blank |
Chromate solutions |
||||
| K2Cr2O7(S) |
- |
1 |
2 |
3 |
4 |
5 |
| 6 NaOH (S) |
2 |
2 |
2 |
2 |
2 |
2 |
| H2O (S) |
7 |
6 |
5 |
4 |
3 |
2 |
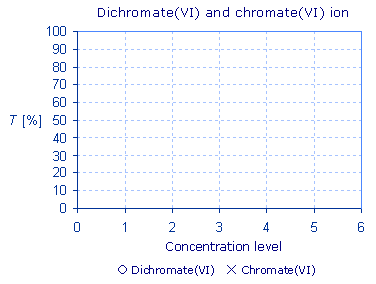
Measure the transmittance of dichromate and chromate solutions with SPEKTRATM spectrometer using the blue LED against the blank. Plot the results into the graph.
Plot the results in the graph below.

If the proportional factor k, which depends on the substance, is introduced into the exponential part of the relationship T µ e-cb the formula is as follows:
T =
In chemistry practice the exponential relationship between the measured physical quantity and concentration are not desirable. Linear relationships are better suited for practical applications.
Exponential relationship T µ e-kcb can be transformed into linear one by using logarithmic transformation. Afterwards natural logarithm is transformed into decadic logarithm, and instead of k/2,303 we introduce a molar absorption coefficient (ε) and a new term, i.e. - absorbance (A). This relationship is called Lambert – Beer’s Law.
|
A = e c b |
Lambert – Beer’s Law
Symbol A stands for absorbance, c for the amount concentration of a solution (mol L-1), b is the light path length through the absorption medium (cm). Symbol ε denotes molar absorption coefficient of a species at a certain wavelength, and defined conditions. The equation above shows that the unit for molar absorption coefficient is L mol-1 cm-1.
Complete the following relationship between the absorbance and transmittance. (Hint. The absorbance is related to the transmittance in a similar way as the pH to the concentration of oxonium ions in the solution.)
| A = ________T |
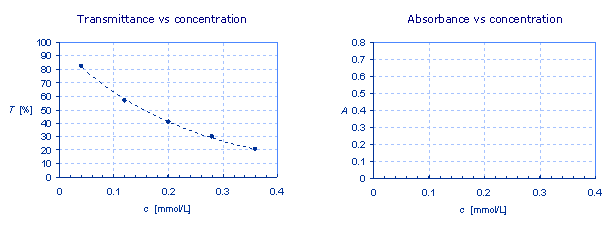
Calculate the absorbance from the transmittance values given in the table. Transmittance can be expressed as the share of 1, or in percent. When calculating the transmittance, it must be expressed as the share of 1.
| c (mmol/L) |
0.04 |
0.12 |
0.20 |
0.28 |
0.36 |
| T |
0.826 |
0.570 |
0.408 |
0.298 |
0.205 |
| A |
|
|
|
|
|
In the chart on the left side the values of transmittance are plotted against the concentration. Plot the values for the absorbance at different concentrations in the chart on the right.

Developed and prepared by: Nataša Gros, University of Ljubljana, Faculty of Chemistry and Chemical Technology and Margareta Vrtačnik, University of Ljubljana, Faculty of Natural Sciences and Engineering