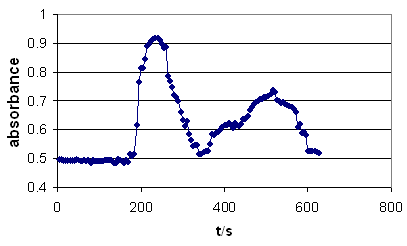
|
t/s |
A |
|
5 |
0.4975 |
|
10 |
0.4962 |
|
15 |
0.4948 |
|
20 |
0.4934 |
|
25 |
0.4934 |
|
30 |
0.4934 |
|
35 |
0.4934 |
|
40 |
0.4934 |
|
45 |
0.4975 |
|
50 |
0.4975 |
|
55 |
0.4948 |
|
60 |
0.4948 |
|
65 |
0.4962 |
|
70 |
0.4921 |
|
75 |
0.4975 |
|
80 |
0.4875 |
|
85 |
0.4975 |
|
90 |
0.4921 |
|
95 |
0.4934 |
|
100 |
0.4948 |
|
105 |
0.4934 |
|
110 |
0.4948 |
|
115 |
0.4962 |
|
120 |
0.4962 |
|
125 |
0.4975 |
|
|
t/s |
A |
|
130 |
0.4962 |
|
135 |
0.4867 |
|
140 |
0.4867 |
|
145 |
0.4987 |
|
150 |
0.4962 |
|
155 |
0.4948 |
|
160 |
0.4867 |
|
165 |
0.4962 |
|
170 |
0.4881 |
|
175 |
0.5171 |
|
180 |
0.5114 |
|
185 |
0.5171 |
|
190 |
0.6179 |
|
195 |
0.767 |
|
200 |
0.8124 |
|
205 |
0.8124 |
|
210 |
0.8446 |
|
215 |
0.889 |
|
220 |
0.8961 |
|
225 |
0.9065 |
|
230 |
0.9136 |
|
235 |
0.9172 |
|
240 |
0.9172 |
|
245 |
0.91 |
|
250 |
0.8962 |
|
|
t/s |
A |
|
255 |
0.8827 |
|
260 |
0.886 |
|
265 |
0.785 |
|
270 |
0.7695 |
|
275 |
0.7495 |
|
280 |
0.7212 |
|
285 |
0.7144 |
|
290 |
0.6989 |
|
295 |
0.6615 |
|
300 |
0.6345 |
|
305 |
0.6144 |
|
310 |
0.6326 |
|
315 |
0.585 |
|
320 |
0.567 |
|
325 |
0.545 |
|
330 |
0.5466 |
|
335 |
0.5482 |
|
340 |
0.5185 |
|
345 |
0.5185 |
|
350 |
0.5228 |
|
355 |
0.5287 |
|
360 |
0.5272 |
|
365 |
0.5528 |
|
370 |
0.585 |
|
375 |
0.5833 |
|
|
t/s |
A |
|
380 |
0.5883 |
|
385 |
0.5934 |
|
390 |
0.5985 |
|
395 |
0.609 |
|
400 |
0.6178 |
|
405 |
0.6178 |
|
410 |
0.6246 |
|
415 |
0.6161 |
|
420 |
0.6055 |
|
425 |
0.6252 |
|
430 |
0.6161 |
|
435 |
0.6144 |
|
440 |
0.6216 |
|
445 |
0.6363 |
|
450 |
0.6382 |
|
455 |
0.6478 |
|
460 |
0.6695 |
|
465 |
0.6777 |
|
470 |
0.6882 |
|
475 |
0.6968 |
|
480 |
0.6989 |
|
485 |
0.7055 |
|
490 |
0.7077 |
|
495 |
0.7121 |
|
500 |
0.7144 |
|
|
t/s |
A |
|
505 |
0.7189 |
|
510 |
0.7258 |
|
515 |
0.7375 |
|
520 |
0.7314 |
|
525 |
0.7033 |
|
530 |
0.6989 |
|
535 |
0.6946 |
|
540 |
0.6968 |
|
545 |
0.6882 |
|
550 |
0.6861 |
|
555 |
0.684 |
|
560 |
0.6777 |
|
565 |
0.6716 |
|
570 |
0.6615 |
|
575 |
0.609 |
|
580 |
0.6198 |
|
585 |
0.5883 |
|
590 |
0.5934 |
|
595 |
0.5833 |
|
600 |
0.5272 |
|
605 |
0.5287 |
|
610 |
0.5272 |
|
615 |
0.5287 |
|
620 |
0.5228 |
|
625 |
0.5214 |
|