|

ADSORPTION ISOTHERMS
Investigations Into The
Use Of A Small Scale Spectrophotometer
For Level 3 Science Delivery
Tom Lawless
Chemistry
Department
Weymouth College
Dorset
DT4 7LQ
Background
In September 2004, Weymouth
College were one of four educational
institutes in the country to
be selected, to evaluate the
performance of a novel, small-scale
spectrophotometer. The multipurpose
spectrometer, SpektraTM,
is a tri-colour light emitting
diode-based, in-situ spectrometer,
with the advantage that it can
house sampling trays containing
10 separate and small volume
(~350ml)
test zones.
The spectrometer had been
introduced into schools as part
of an EU sponsored ‘Leonardo
da Vinci’ project between participating
academic institutes in England,
Portugal and Slovenia, with
the UK partner being Hull University
(programme coordinator Prof.
Alan Townshend). The remit of
the evaluation phase was to
allow level 3 chemistry students
(16 to 19 year old) to use,
assess and explore the benefits
(and drawbacks) of the spectrophotometer
in a ‘real’ laboratory environment.
The evaluation phase would last
1 academic year and feedback
on our findings would be given
at a National Teachers Conference
at the University of Hull on
5 and 6 July 2005.
Introduction
Colour is all around us and
provides many opportunities
to engage students in fundamental
principles associated with chemistry.
Spectroscopy, and more specifically
visible spectroscopy, enables
students to understand the origin
of colour and how measurements
can be made to quantitatively
analyse samples. The applicability
of such an instrument to chemistry
delivery in Weymouth College
is briefly described below.
Level 3 Applicability
Colour, electron transitions,
quantum theory, dyes, fabrics,
charcoal adsorption, calibration
graphs, competition effects,
dissolution processes and various
other aspects associated with
organic and inorganic compounds
are relevant to level 3 study.
The opportunity to engage some
A2 and AVCE students during
their “Individual Investigations”
was taken this year and enabled
the production of some interesting
and valuable experimentation.
Student Investigations
These focussed on the production
of adsorption isotherms using
dyes from aqueous solution onto
an activated charcoal. The 2
anionic dyes chosen for test
purposes were ACID BLUE 45 and
BRILLIANT CROSEIN MOO (red)
since these satisfied colours
from opposite ends of the spectrum
and were compatible in solution.
Adsorption processes were conducted
for the individual dye systems
and then when in a mixed dye
competitive study.
Charcoal: Darco G60
Dyes:
Acid Blue 45, Brilliant Crosein
MOO
Temperature: Room Temperature
Equilibration
Time: Minimum of 48 hr
Equilibrated
systems: 40 cm3 dye solution
(concentrations ranged from
0.5 – 0.004 % w/v) + 0.30 g
charcoal placed in 100 cm3 screw
top glass bottles.
[Mixed
dye system was 1:1 ratio and
concentrations subjected to
test covered same concentration
ranges as above]
*After equilibration,
filter off samples and read in
spectrometer (dilute as necessary)
Calibration Graphs
A series of dilutions were
made to identify suitable ranges
for the dye systems. Values
recorded were transposed into
absorbance values for all data
use. The following profiles
were recorded.
Fig. 1 Calibration
Graph for Acid Blue (350ml
in blister pads)
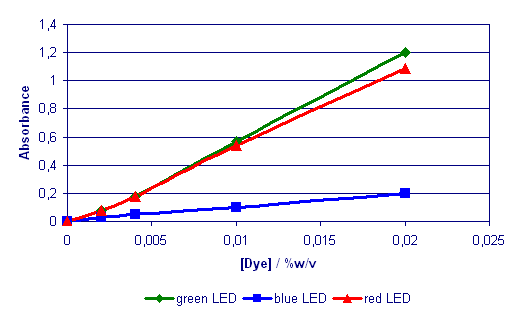
Fig. 2 Calibration
Graph for Brilliant Crosein
MOO (350ml in blister
pads)
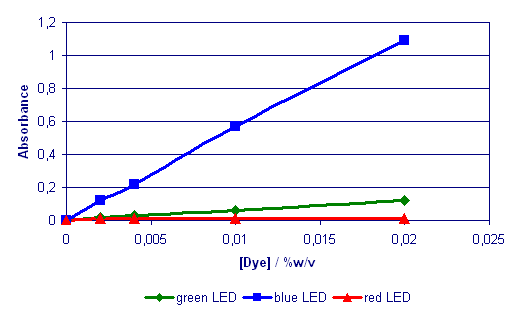
Fig 3. Calibration
Graphs for the mixed (1:1) dye
system (350ml in blister pads)
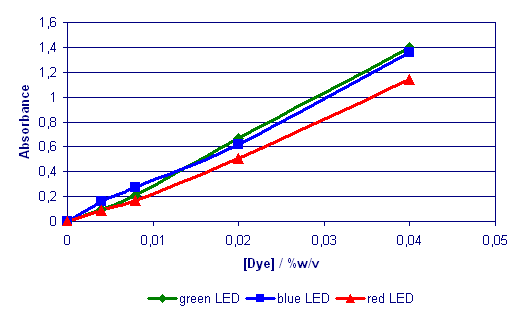
Linear correlations were
established for all dye systems
examined but it was rather problematic
to see the absorbance values
for the different LEDs without
any concrete supporting evidence.
Furthermore the mixed dye response
revealed potential difficulties
in abstracting meaningful data
from test results. To resolve
such issues the dye systems
were subjected to a scanning
visible spectrophotometer study.
Scanning Visible Spectrum
Traces
The traces recorded are shown
below in Fig. 4 It is important
to note that the 3 LED wavelengths
for the SpektraTM instrument
are at 430, 565 and 625 nm and
inspection of the profiles below
help to explain why absorbance
values will be picked up using
different LEDs. The Blue dye
shows that it absorbs in an
approximately equal manner across
the red and green LEDs but to
a lesser extent for the blue
LED [NB nevertheless it does
absorb using this LED and when
the mixed dye system is being
evaluated some compensation
must be made for this event]
Fig.4 Visible
scans for the 2 dye systems
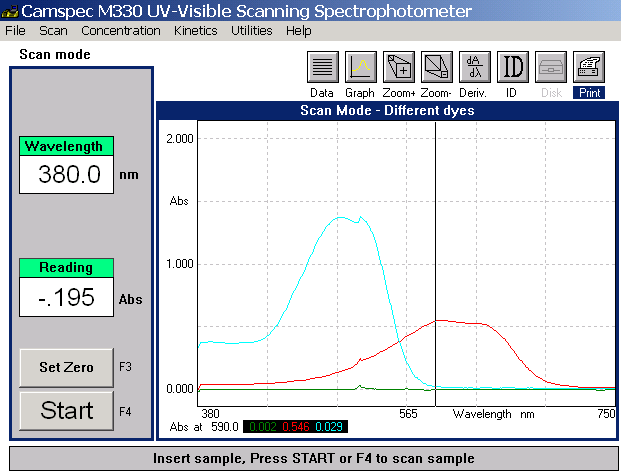
The red dye system shows
a strong absorbance for the
blue LED with a much lower absorbance
with the green. It is important
to note that it does not absorb
in the range of the red LED.
Such findings fully support
the SpektraTM readings and reveal
negligible values for red dye
using the red LED. [NB it is
possible to use the red LED
to quantitatively determine
the presence of the blue dye
without any interference from
the red dye in competition studies]
The mixed dye system was
subjected to analysis and this
is recorded below.
Fig 5 Mixed
dye visible spectrum
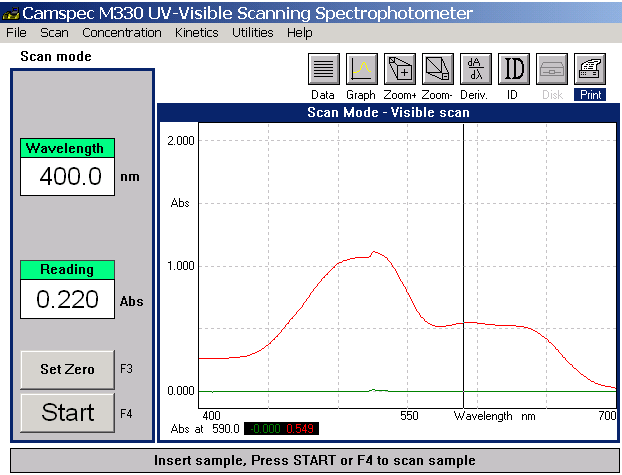
The mixed profile provides
a simple summation of the individual
absorbance values recorded.
Inspection of this data and
the SpektraTM data enabled the
following analysis to be identified
when working with mixed dye
systems.
- Measuring the Blue dye:
Use red LED and no interference
will be observed
- Measuring the red dye:
Use the blue LED BUT make
an allowance for the interference
from the presence of the
blue dye.
Now the interference will
be a direct consequence of the
amount of blue dye present.
LET RED LED ABSORBANCE VALUE
= X (proportional to blue dye
content)
Then since such values always
show a recorded absorbance with
the blue LED of approximately
= 0.2 X then this value must
be subtracted from the measurements
recorded with the blue LED to
determine the true value for
the red dye.
LET BLUE LED ABSORBANCE VALUE
= Y
Then Red dye content = Y
– 0.2 X
Using this approach it was
possible to establish the adsorption
profiles for mixed dye systems.
Adsorption isotherms
Individual and mixed dye
adsorption profiles were established
using the calibration procedures
identified above.
Fig. 6 Adsorption
Isotherm For Brilliant Crosein
MOO
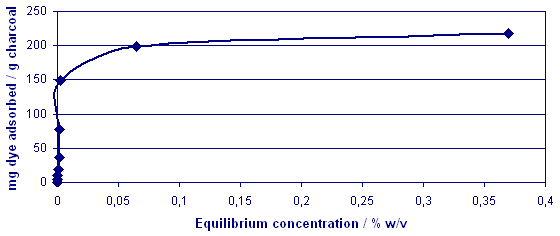
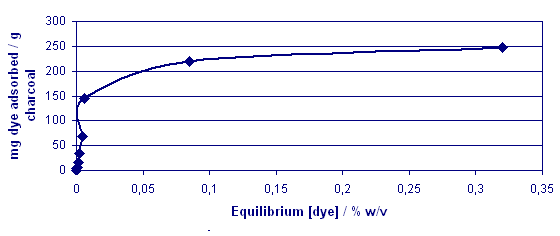
A typical Langmuir profile
was established and this was
also evident for the next dye
sample
Fig. 7 Adsorption
Isotherm For Acid Blue 45
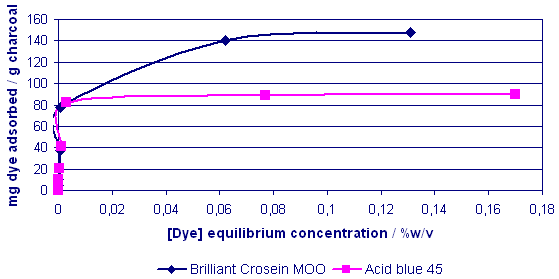
The mixed dye system was
examined and showed that in
competition the red dye appeared
to dominate adsorption sites
to a certain extent.
Fig. 8 Mixed
Dye Adsorption Profiles
Discussion / Conclusions
Once a chosen system has
been identified it is possible
to produce calibration graphs
to identify adsorption processes
under individual and competition
scenarios. The availability
of a scanning visible spectrometer
helps to explain such demands
more clearly. This activity
proved quite extensive for the
students involved and incorporates
many key facets associated with
science and their study programmes.
The advantages and disadvantages
experienced are briefly:
Advantages
The
equipment is easy to use, and
calibrate. It is also easy to
read the meter. Only small volumes
of sample and reagent are required,
thus minimizing the cost, and
any hazards, including disposal
of materials after use. The
blister pad can be used to monitor
10 samples; the 10 samples can
be monitored with respect to
time – for example, starch-enzyme
kinetic experiments could be
monitored simultaneously under
different pH conditions.
Disadvantages
The
use of a dropper is non-quantitative,
and the blister will not be
suitable for certain solvents.
Spillage of chemicals inside
the spectrometer should be avoided,
but the active components are
insulated from contamination.
The instrument booklet needs
more explanation and diagrams
(This has been attended to).
The drop volume depends on the
surface tension of the liquid,
which could lead to errors.
|