10.
Spectrometric determination
of glucose
THEORETICAL BACKGROUND
A number of chemical reactions
may occur between sugars and
various reagents producing coloured
product. The intensity of colour
is related to the concentration
of sugar present. Absorbance
can be measured and related
to concentration of sugars in
standard solutions. Only a limited
number of reactions are known
for polysaccharides and most
involve simple sugars, usually
reducing sugars. A method for
determination of glucose in
jam consists of hydrolysis of
total sugars with H2SO4
and neutralisation of the sample
with NaOH. After heating the
DNS reagent reacts with reducing
sugars producing red-brown product.
The concentration of coloured
complex can be determined with
the spectrometer SpektraTM using
the blue LED.
PRINCIPLE
In hot solution DNS reagent
(3,5-dinitrosalicil acid) reacts
with reducing sugars producing
red-brown product 3-amin,5-nitosalicil
acid. Concentration of coloured
complex is measured with the
SpektraTM
spectrometer using the blue
LED (540nm).
EQUIPMENT AND REAGENTS
- SpektraTM
spectrometer
- jam
- DNS reagent
(3,5dinitrosalicil
acid)
- H2SO4
solution (c=
1,5mol/L)
- NaOH solution
(w=10%)
- pipettes
|
- 100 mL volumetric
flasks
- test tubes
- balance
- water bath
- funnel
- filter paper
|
Preparation of DNS reagent
– 3,5-dinitrosalicil acid
Weigh 10 g of DNS and dissolve
it in 200 mL NaOH solution (c
= 2 mol/L). Heat the solution
and stir intensively. Add colour
stabiliser Na-K-tartrate (disolve
300g of Na-K-tartrate in 500
mL of distilled water). Combine
both solutions, stir well and
add distilled water to 1 L.
SAMPLE PREPARATION
- Jam – sugars
Weigh
1 – 2 g of jam into Erlenmeyer
flask. Add 10 mL of H2SO4
(c = 1,5mol/L). Heat in
boiling water bath for 20minuts.
Stir periodically unstill
hydrolysis is completed.
Cool the sample and carefully
add 12 mL of NaOH (w = 10
%). Stir and filter into
100 mL volumetric flask,
fill with distilled water
to 100 mL. Transfer with
pipette 10 mL of solution
into another 100 mL volumetric
flask and fill with distilled
water to 100 mL. Stir well.
- Jam – reducing sugars
Weigh
cca. 3 g of jam into Erlenmeyer
flask add 50 mL of distilled
water, heat and stir for
10 minuts. Filter into 100
mL volumetric flask. Fill
the flask with distilled
water to 100 mL. Transfer
with pipette 10 mL of solution
into another 100 mL volumetric
flask and fill with distilled
water to 100 mL.
PRODUCING COLOUR AND MEASURMENTS
Stock standard glucose solution
Weigh 1.5 g of glucose, transfer
it into 100 mL volumetric flask,
fill with distilled water to
100 mL and stir. g(
glu) = 15 mg/mL
Standard solutions for
calibration curve
Prepare 5 (100 mL) volumetric
flasks and mark them. Transfer
with pipette into each flask
different volume of standard
glucose solution and distilled
water as specified below:
|
flask
|
1
|
2
|
3
|
4
|
5
|
|
st. glucose sol.
(mL)
|
2
|
3
|
6
|
8
|
10
|
|
dist. water (mL)
|
98
|
97
|
94
|
92
|
90
|
Mass concentrations of glucose
in calibration solutions are:
|
flask
|
1
|
2
|
3
|
4
|
5
|
|
mass conc. (mg/mL)
|
0.3
|
0.45
|
0.9
|
1.2
|
1.5
|
Prepare 6 test tubes and
fill them as specified below:
|
sample
|
1
|
2
|
3
|
4
|
5
|
6
|
|
stand. sol. (mL)
|
|
1
|
1
|
1
|
1
|
1
|
|
st. sol. conc.
(mg/mL)
|
|
0.3
|
0.45
|
0.9
|
1.2
|
1.5
|
|
DNS reagent (mL)
|
|
1
|
1
|
1
|
1
|
1
|
|
distilled water
(mL)
|
10
|
2
|
2
|
2
|
2
|
2
|
Heat test tubes in boiling
water for 5 minutes. DNS reacts
with sugar while heated producing
red-brown product. Cool test
tubes and add 6 mL of distilled
water into each test tube. Shake
well. Transmittance of solutions
can now be measured using the
blue LED (540nm).
CALCULATIONS
Glucose concentration in
100 g of sample is calculated
as follows:
g glucose
/ 100 g sample = g
(glucose) · 10 · 100
10 = dilution
100 = volume
of 1g of sample
MEASUREMENTS AND RESULTS
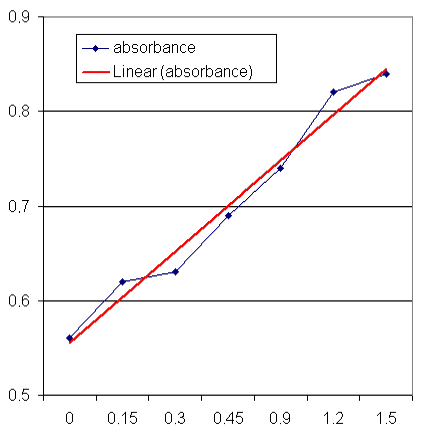
Table 1: Calibration curve – Absorbance
related to mass concentration
|
mass
concentration
(mg/mL)
|
absorbance
|
|
0
|
0.56
|
|
0.15
|
0.62
|
|
0.3
|
0.63
|
|
0.45
|
0.69
|
|
0.9
|
0.74
|
|
1.2
|
0.82
|
|
1.5
|
0.84
|
|
|
Graph
1: Calibration curve – absorbance
related to mass concentration

Developed
and prepared
by: Alma
Kapun Dolinar in Irena Štrumbelj
Drusany, Srednja agroživilska
šola Ljubljana
|

